Triage User Issues
These are common scripts and tasks for lookup up data in production
Prerequisites
Before you can access any systems, you will need to set up AWS-vault
SSM Documents
We used AWS SSM, which is kind of like SSH. Our main script, ssm-instance is set up for a few documents aimed at common tasks. See the guide to ssm-instance for more information
on the script and the documents.
Inside a Rails Console
Inside a Rails console (see rails-c) here are some other things you can do to quickly get a sense of how a user’s account is set up
Find a user by email
This is what uuid-lookup does under the hood basically
user = User.find_with_email('address@example.com')
user.uuid
Check what MFA methods they have configured
MfaContext.new(user).enabled_two_factor_configuration_counts_hash
=> { :phone => 1, :backup_codes => 10 }
Check events
user.events.count
=> 10
user.events.pluck(:created_at).minmax
=> [Mon, 03 Apr 2021 18:53:38.820730000 UTC +00:00, Wed, 29 Jun 2022 16:47:46.275708000 UTC +00:00]
Check what SPs the user has connected to
user.identities
Cloudwatch Logs
Once you have a user’s UUID (from uuid-lookup), you can look in Cloudwatch logs for
events.log events for that user.
See also Troubleshooting Quick Reference - Cloudwatch Logs
Commonly used logs
| Log Group Name | AWS Environment | Notes |
|---|---|---|
prod_/srv/idp/shared/log/events.log |
login-prod | For a full list of documented events, see Analytics Events |
prod_/srv/idp/shared/log/production.log |
login-prod | The Rails log |
/aws/lambda/SESAllEvents_Lambda |
login-prod | Simple Email service (SES) events with usernames redacted. |
/aws/lambda/pinpoint_event_logger |
login-sms-prod | Pinpoint (SMS) service events with phone numbers redacted. See SMS delivery for more information. |
Cloudwatch Insights
- Open up AWS console (
aws-vault login prod-power) - Navigate to “Cloudwatch”, then find “Logs Insights”
- Select
prod_/srv/idp/shared/log/events.logfrom “Log Groups” - Select a time range
- Enter a query
Saved Queries
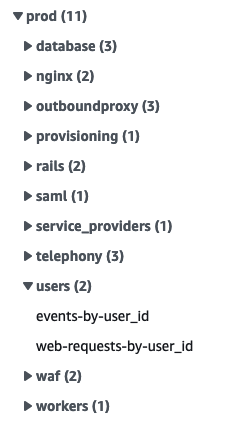
On the right side of the page, we have a few saved queries useful for common triage tasks under “user” under “prod”.
Via the command line
Cloudwatch queries are limited to 15 minutes and 10,000 rows. To get around these limitations,
we have a script that runs the same query over adjacent slices in time, see the
guide to query-cloudwatch for more
information.
Sample Queries
A sample triage query to track events for a particular user might look like this:
fields
  name,
  properties.user_id,
  properties.user_ip,
  properties.event_properties.success,
  @timestamp,
  @message
| filter properties.user_id = "USER_ID_HERE"
| sort @timestamp desc
| limit 10000
Note: Some visited events repeat as the page polls for background jobs to complete. It’s not that the user was repeatedly visiting that page.
Add fields
To scan through a property for a lot of events, add it to the field list.
For example, adding fields for properties.browser_mobile and
properties.session_duration make it easier to see when a user changes
devices or starts a new session.
Workflows
Find a user by phone number
We don’t have indexed lookups by phone number so we need to combine a few approaches to get a user’s phone number
-
Normalize and fingerprint the phone
In a Prod Rails console (to use the correct hash salts)
parsed_phone = Phonelib.parse("+1 (888) 867-5309") fingerprints = [ Pii::Fingerprinter.fingerprint(parsed_phone.e164), *Pii::Fingerprinter.previous_fingerprints(parsed_phone.e164) ] # => ["aaa", "bbb", "ccc"] -
In Cloudwatch, look up OTP requests to those fingerprints. It helps to have an approximate date this user was active to help narrow down the Cloudwatch search time frame.
fields
  properties.user_id,
  @timestamp
| filter name = 'Telephony: OTP sent'
| filter properties.event_properties.phone_fingerprint in ["aaa", "bbb", "ccc"] # CHANGE THIS
Find the user id for a 500 error in production.log
Click on the name of the error in New Relic to get a more detailed view.
We add user_id as a custom attribute in New Relic. Scroll down in Attributes on the New Relic error page to see if it is available. If not, look for the error in production.log as follows.
At the top of the New Relic error page, find the approximate time of the error. Note timezones for both New Relic (usually local) and AWS (usually UTC) and convert if needed.
Note the path, if it wasn’t from a worker. Change the filter line below to match error status and path.
- Open up AWS console (
aws-vault login prod-power) - Navigate to “Cloudwatch”, then find “Logs Insights”
- Select
prod_/srv/idp/shared/log/production.logfrom “Log Groups” - Select a time range that includes the error
- Enter this query. Edit the status and path to match the error.
fields @timestamp, user_id, @message, @logStream, @log
| filter status = 500 and path like /verify/
| sort @timestamp desc
| limit 200
The field you want is
user_id, notuuid.
Then switch to prod_/srv/idp/shared/log/events.log and use the sample query
above to find events for that user_id. Add a wide time range around
the error to see what led up to it. There may not be an events.log entry for the error itself.