CloudWatch Insights 101
Prerequisites
You will need an AWS account and access. See setting up aws-vault for more information.
Getting to CloudWatch Insights
- Log in to AWS
- Via terminal:
# depending on the roles you have pick between aws-vault login prod-analytics # or aws-vault login prod-power - Via AWS GUI:
The console login method does not allow a user to switch roles or environments (ie,
sandbox-power). If you know you will need to switch back and forth, it may be easier to log in via the AWS GUI.- Navigate to AWS
- Click the
Sign In to the Consolebutton on the top right - Input Account ID as
login-master, and your IAM username and password - Click
Sign In - Generate an MFA Code with your Yubikey
- Enter MFA code
- Click
Submit - Click on the top right user dropdown and click on
Switch roleto log into the appropriate role.
- Via terminal:
-
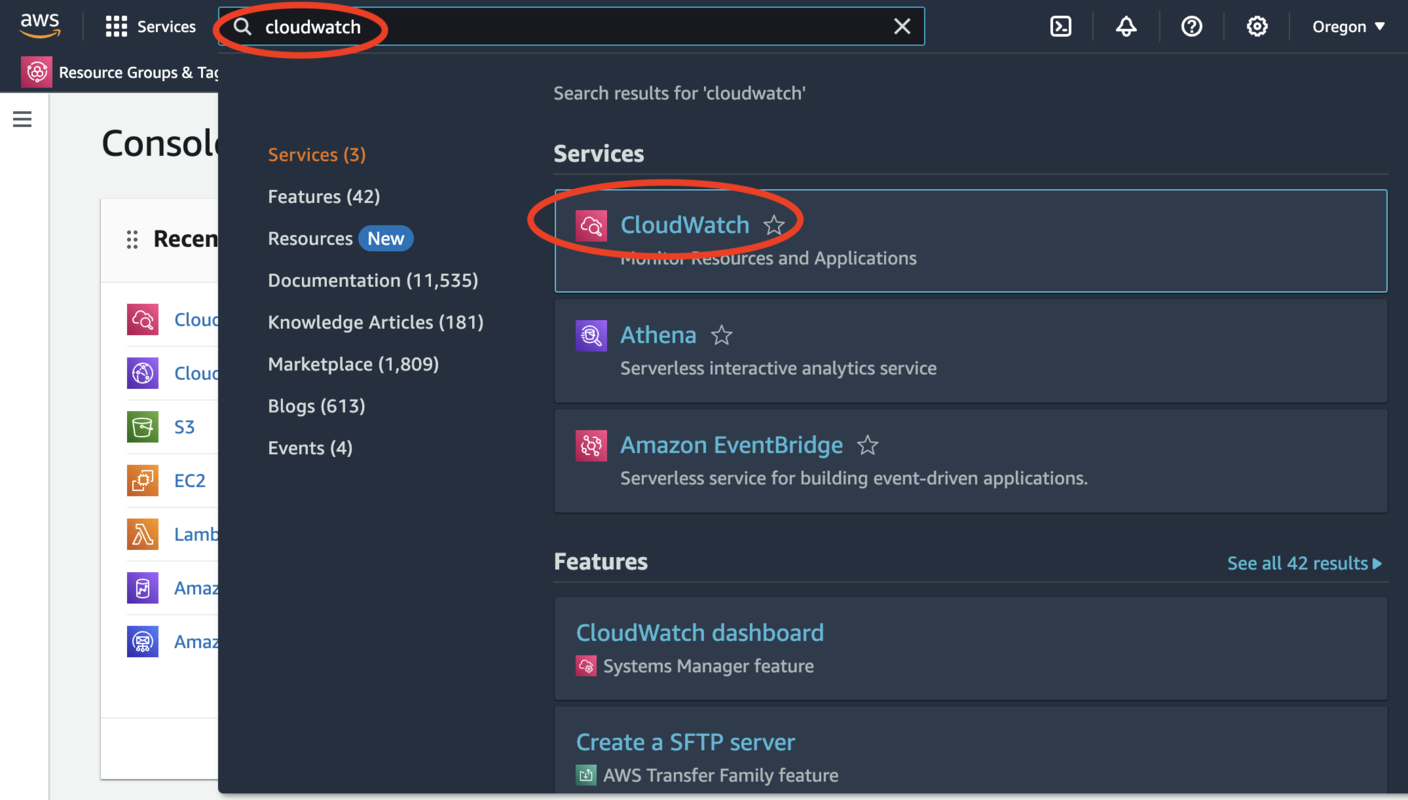
Search for “CloudWatch”
-
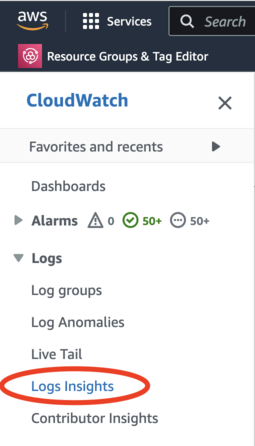
Select “Logs Insights”
Running a query
-
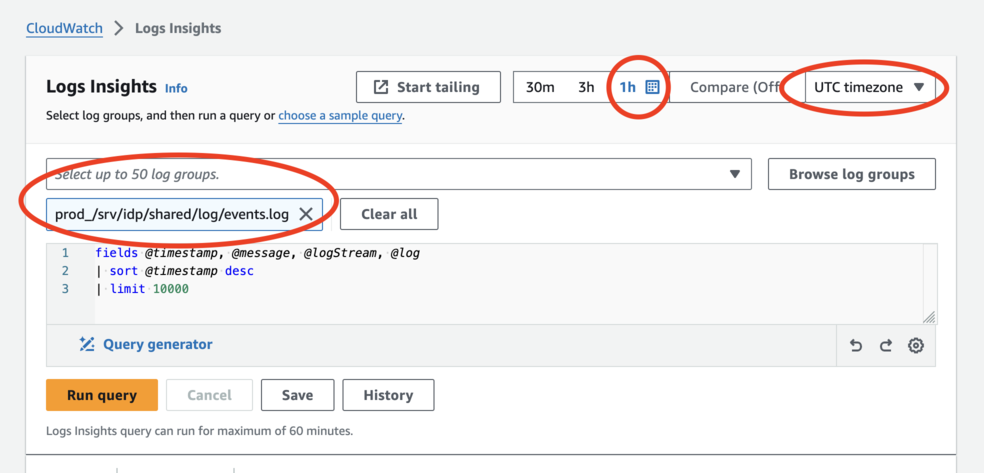
Make sure to select a log group. For most queries, we want
prod_/srv/idp/shared/log/events.log. In the “Select up to 50 log groups” combobox, type in “events.log” to filter down the list and select the prod_ one. -
Set the time range. For consistency across timezones, we recommend the UTC timezone.
-
Write your query, and hit “Run Query”
If you are comfortable with the command line, you can also use our query-cloudwatch script, which can be useful for batch processing.
Common Queries
Filtering by event
See Analytics Events for the most up-to-date documentation of individual events and their fields.
This query filters down to one event, “SP redirect initiated”:
fields @timestamp, name, properties.event_properties.success, @message
| filter name = 'SP redirect initiated'
| limit 10000
This query filters to any one of multiple events:
fields @timestamp, name, properties.event_properties.success, @message
| filter name in ['SP redirect initiated', 'User registration: complete']
| limit 10000
Filtering by user
The Login.gov internal UUID is logged as properties.user_id, so we can filter based on that.
A query for one user:
fields @timestamp, name, properties.event_properties.success, @message
| filter properties.user_id = 'aaaa-bbbb-cccc-dddd'
| limit 10000
A query for multiple users:
fields @timestamp, name, properties.event_properties.success, @message
| filter properties.user_id in ['aaaa-bbbb-cccc-dddd', '1111-2222-3333-4444']
| limit 10000
Writing Queries
The AWS documentation for CloudWatch Insights is fairly thorough. If anything is left unanswered after reading this guide, that documentation is likely to contain the answer.
Similarity to SQL
If you’ve used SQL, a lot of concepts map to CloudWatch Insights queries nicely:
| SQL | CloudWatch Insights |
|---|---|
SELECT |
fields or display |
WHERE |
filter |
GROUP BY |
stats ... by |
ORDER BY |
sort |
LIMIT |
limit |
Limitations and Workarounds
Joins
CloudWatch Insights does not support joins
Max 10,000 rows
Use the query-cloudwatch script with the --complete option, it will
automatically break re-query for shorter time ranges until it has all matching rows.
Too many fields
CloudWatch Insights gives up on parsing after there are too many fields in a blob. To work around it, export the full @message field and parse it externally, such as in Ruby
Array iteration
Similar to too many fields, this can be worked around by parsing externally.
Another approach is to use the parse command to manually parse out a specific field
count_distinct
Briefly: Do not use count_distinct, it is inaccurate
From the AWS documentation on count_distinct:
Returns the number of unique values for the field. If the field has very high cardinality (contains many unique values), the value returned by count_distinct is just an approximation.
To work around this, there are a few options
- Consider doing post processing externally, the
query-cloudwatchscript has a--count-distinctoption to streamline this -
If there are fewer than 10,000 things, you can use plain
count(*):| stats count(*) by PROPERTY_TO_COUNT - If you’re trying to deduplicate events logged in the same session, you can
filter properties.new_eventto consider events logged for the first time in a session. Note thatnew_eventwill always betruefor “successful” events (properties.event_properties.success). -
CloudWatch supports multiple
statsaggregation, so you can group by a property occurring at least once before summing a count. Note that these can be query-intensive and take a long time to run.filter name = 'some_page_visited' | stats count(*) > 0 as visited_once by properties.user_id | stats sum(visited_once)